
Monday, July 23, 2012
What next?
We got to my target ~135 in the SPY much faster than I had anticipated, so what now? Well, I think we're headed lower... we might consolidate for 1-2 days, but the next target that I'm looking for is ~132, where the 200d will be in a few days!

Sunday, July 22, 2012
Watchlist for the week of July 22nd, 2012
So last week we got to my 138 target on the SPY and near the top of the bear flag on the daily chart. I went short near that target, but I was too scared to hold over the week-end. The SPY and the DIA printed a doji on thursday, right near resistance, so that was a fairly good "caution" signal. The next day we gapped down, so it seems we might have a short-term change in trend. I'm expecting more decline in the indices this week, but we might need to consolidate a little more before a fall back down to the ~135 area in the SPY, as there are many moving averages below the current price that will serve as support (the 10, 20, 50 and 100d MAs). Eventually, I think we might break down from this bear flag on the daily, but I'll have to see confirmation of that before going all in short! Below is a daily chart of the SPY, with my target near 135 highlighted:

Here are some stocks I'm watching for the week:
Long: ENTR, AFFY, GERN (above the 200d only), CLDX, AUTH, ALNY, BWS, COG, KEG, MSM, DDD
Short: AUXL, PCYC, SOHU, GNW, MHR, MCP, SBUX, HTZ, FONR, ORI
Parabolic short: PSTI (I'm already short this name), STEM (also have 1/4 left short), KEQU, PPHM, CPRX, ALJ
Dead cat bounces: DF, WHX (maybe one more day), CMG, OSG, HHS, IRG, GORO, STAA
Good luck this week, and feel free to drop me a line if you have any comments or questions!
Sunday, July 15, 2012
Watchlist for the week of July 16th, 2012
We had a nice bounce in the markets on friday, and I'm expecting a little continuation next week. I suspect we'll see the ~138 level in the SPY, with maybe a little consolidation ~ 136.5 along the way. However, we're forming a bear flag as you can see in the daily chart below, which leads me to believe that we might be headed lower in the intermediate term. I've added a horizontal trendline that is sort of my "bull/bear" line in the sand... I'm also watching the edges of the flag for low risk opportunities and to improve my timing in buying/shorting individual names.

Ideally, I would like to see a lower low in the indices, accompanied by some strong divergence signals, like we saw last summer (the chart below is an example with the MACD divergence, although stochastics, RSI and other indicators also showed some divergences). This is typically what a bottom looks like...

It's also interesting to note the negative divergence that formed two weeks ago in the SPY (shown below), and this also happened back inte Sept-2011, so keep an eye on your indicators to get a sense of the overall possible direction.

Here are some ideas for the week:
Parabolic shorts: AFFY, CADX, ETRM, NVAX
Shorts: RPRX (see the chart below), PCYC, PCRX, SMBL, CYTR, DDS, GNK, FONR
Longs: PRMW, LNG, CIE, DMND, PATK, RSE, PSX, ECYT, ASGN, LPI, DXCM
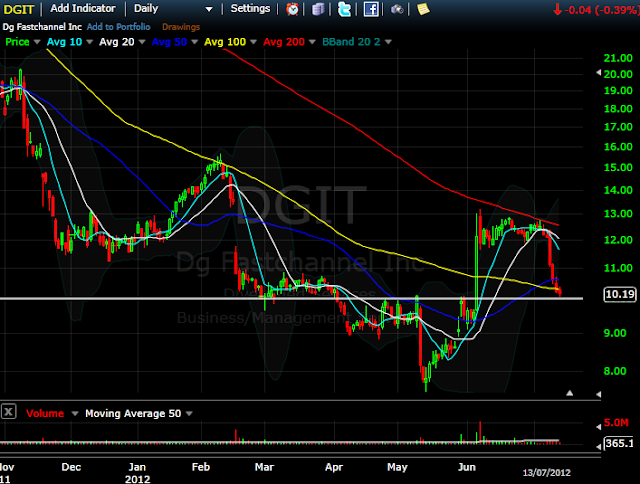
Dead cat bounce: NLST, ADTN, QTM, CALX, SVU, PAL, LXK, AMPE, MAKO, DGIT (sitting on support, see chart below)

It takes me too long to post charts for the whole watchlist, but if you're not sure how to trade these, drop me a line at cathcampbell_25 (at) hotmail dot com and I can explain what I'm seeing and how to trade particular setups.
Good luck this week!


It's also interesting to note the negative divergence that formed two weeks ago in the SPY (shown below), and this also happened back inte Sept-2011, so keep an eye on your indicators to get a sense of the overall possible direction.

Here are some ideas for the week:
Parabolic shorts: AFFY, CADX, ETRM, NVAX
Shorts: RPRX (see the chart below), PCYC, PCRX, SMBL, CYTR, DDS, GNK, FONR
Longs: PRMW, LNG, CIE, DMND, PATK, RSE, PSX, ECYT, ASGN, LPI, DXCM
Dead cat bounce: NLST, ADTN, QTM, CALX, SVU, PAL, LXK, AMPE, MAKO, DGIT (sitting on support, see chart below)


It takes me too long to post charts for the whole watchlist, but if you're not sure how to trade these, drop me a line at cathcampbell_25 (at) hotmail dot com and I can explain what I'm seeing and how to trade particular setups.
Good luck this week!
Subscribe to:
Comments (Atom)